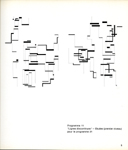
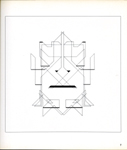
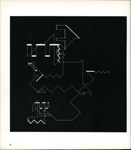
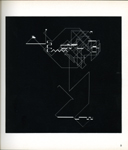
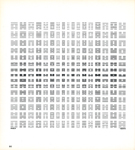
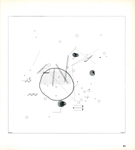
Complete copy of exhibition catalog
"Manfred Mohr Computer Graphics - Une Esthétique Programmée"
ARC - Musée d'Art Moderne de la Ville de Paris in 1971
PDF of catalog Manfred Mohr Computer Graphics, 1971 - (21MB)
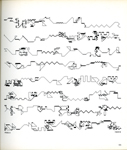
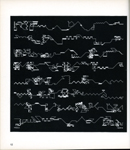
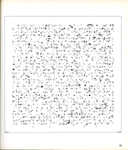
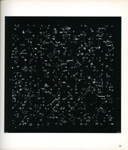
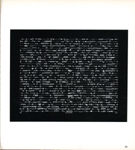
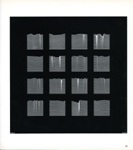
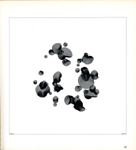
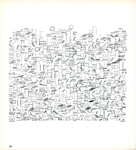
| Note: All the drawings that are shown in the catalog are originally black ink on white paper. White on black images in the catalog were photographically reversed for aesthetic reasons. |
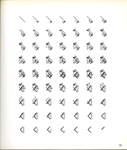
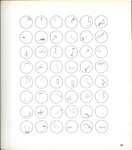
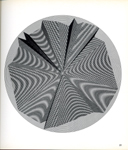
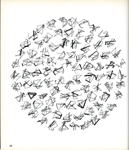
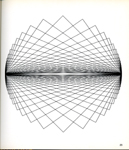
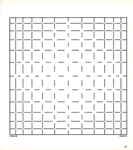
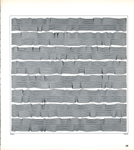
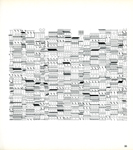
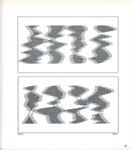
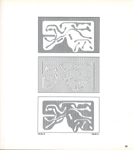
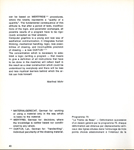
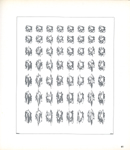
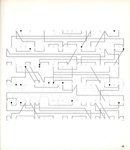
| This work-phase catalog tries to convey the multiple ideas I had at the time and the algorithms I wrote then. Only one or two examples of each algorithm is shown in the catalog. I made a different number of distinct drawings from each algorithm (sometimes many). Thus I had created hundreds of drawings by the time this catalog was printed. |
| The dates of the algorithms displayed in this catalog are as follows: P-10 thru P-18: I made the first drawings from these programs in 1969. I wrote the algorithms and programs at the University of Vincennes, Paris XII (using their SDS computer) where I was one of the people who founded the "Art et Informatique" Group. I also made many light pen plots of P-18 at Brookhaven National Laboratory New York in 1969. The drawings from these algorithms are listed in the catalog as studies for P-21. P-21: The transitional algorithm, 1st drawing from this algorithm was made in 1969 at the University de Vincennes, Paris XII (it took 20 hours to plot). One or two drawings of this algorithm were done on the IBM computer and the Zuse flatbed plotter at the University of Darmstadt, Engineering Dept., Germany. Many drawings from this algorithm were computed and plotted on the CDC computer and the Benson flatbed plotter at Meteologie National Paris in 1970. All drawings from my subsequent algorithms were made on this plotter for the next 13 years. P-25 thru P-67, and P-71: All drawings from these algorithms were first computed and plotted on the CDC computer and flatbed Benson plotter at Meteorologie in 1970. P-70, and P-72 thru P-75: All drawings from these algorithms were first computed and plotted on the CDC computer and the flatbed Benson plotter at Meteorologie National in 1971. I designed and created my own alphanumeric characters, with which I signed my drawings for a time. |
|
|


